DoakBurn (Again)

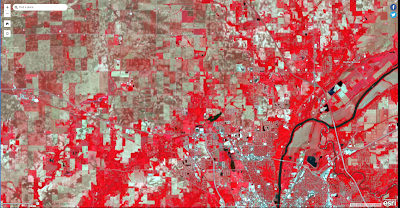
Introduction The goal of this lab was to use ArcGIS Pro to view the various band stacks of orthomosaic imagery and a normalized difference vegetation index (NIVD). The data was collected by Dr.Hupy, William Weldon and Zack Miller, and the data was of a controlled burn with multispectral cameras. Methods The methods of this lab was to look at the areas that were burned and compare them to the areas around them that were not burned. This could be done with RGB, or band stacking for the imagery, which allows the ability to see things that are not able to be seen with the human eye. Metadata from the Flight Vehicle: Bramor PPX Sensor: Altum Flight Number: 2 Takeoff Time: 12:18 Pm Landing Time: 12:35 Pm Altitude (m): 121 Sensor Angle: NADIR Results The data collected with the band stacking shows the differences between the pre-burn and post-burn data. Figure 1,2,4,5,6,9 are in a 5,3,2 band stack, meaning the red represents near-infrared, the green represents th...