DoakBurn (Again)
Introduction
The goal of this lab was to use ArcGIS Pro to view the various band stacks of orthomosaic imagery and a normalized difference vegetation index (NIVD). The data was collected by Dr.Hupy, William Weldon and Zack Miller, and the data was of a controlled burn with multispectral cameras.
Methods
The methods of this lab was to look at the areas that were burned and compare them to the areas around them that were not burned. This could be done with RGB, or band stacking for the imagery, which allows the ability to see things that are not able to be seen with the human eye.
Metadata from the Flight
Vehicle:
Bramor PPX
Sensor: Altum
Flight
Number: 2
Takeoff
Time: 12:18 Pm
Landing
Time: 12:35 Pm
Altitude
(m): 121
Sensor
Angle: NADIR
Results
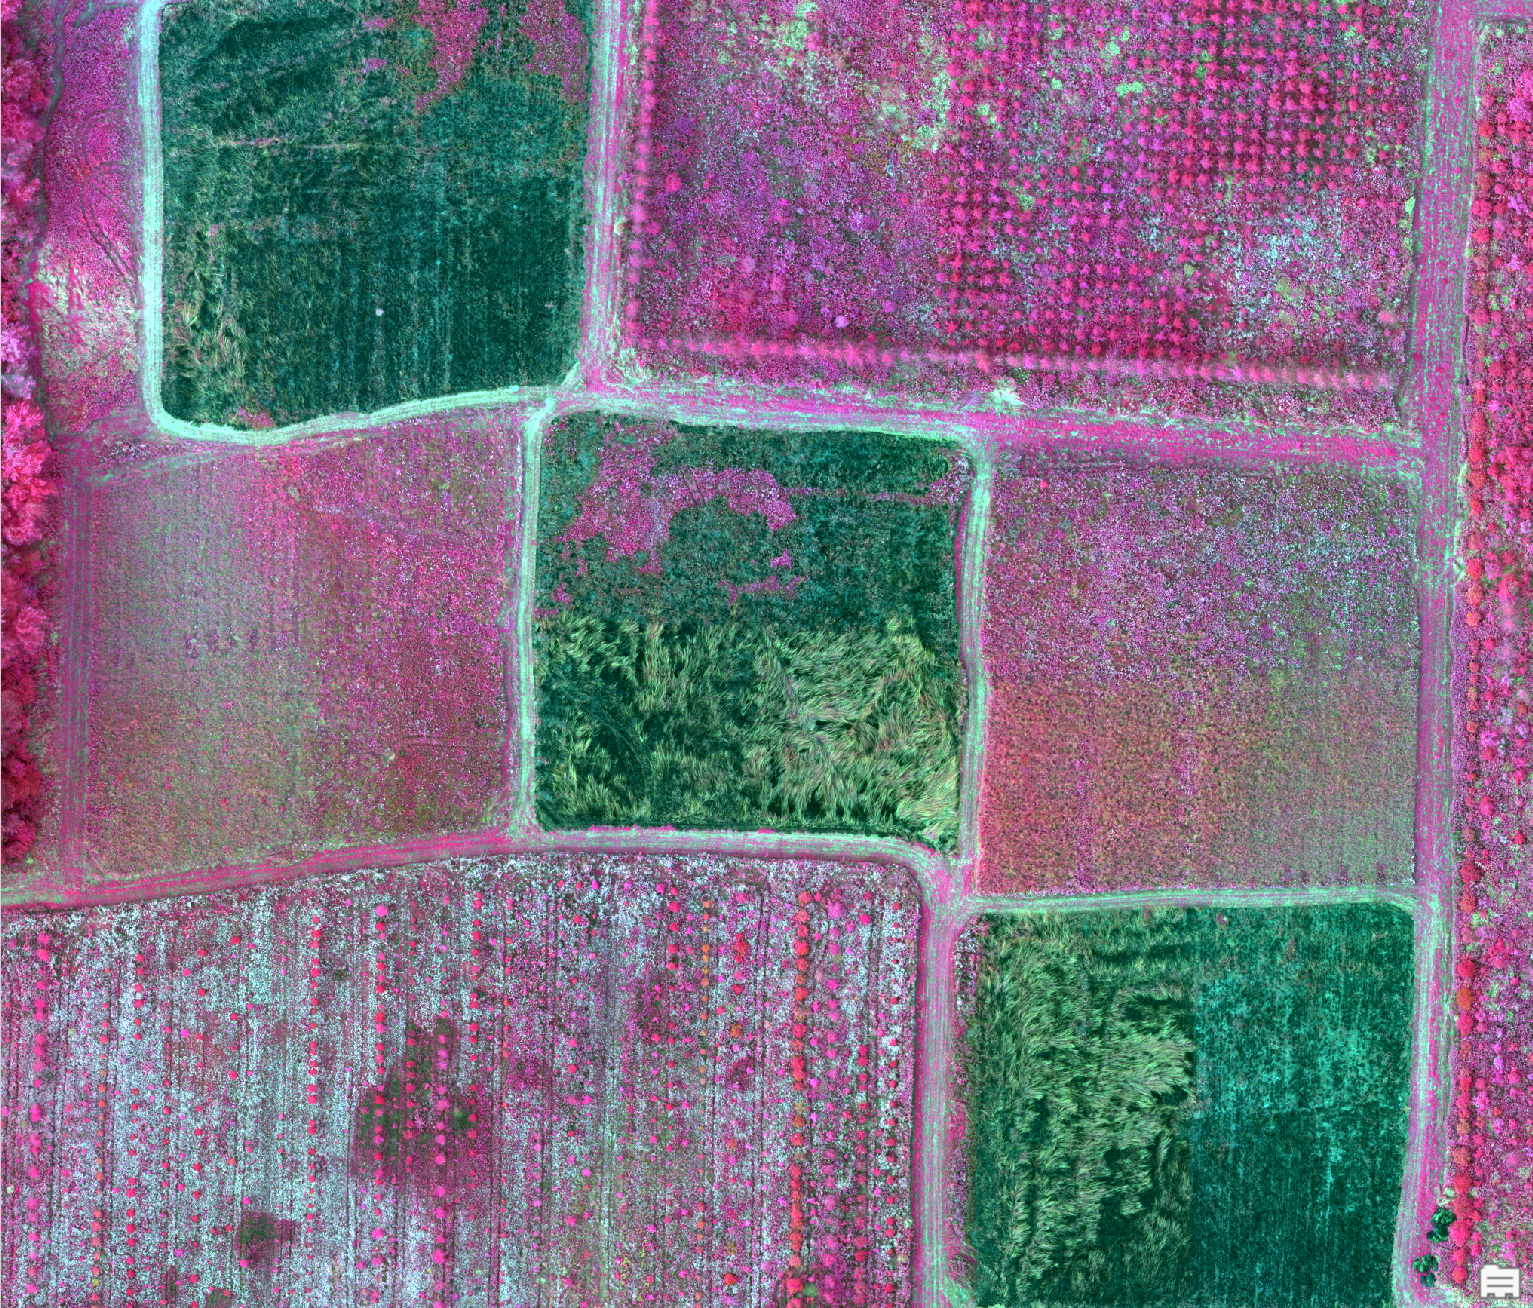
The data collected with the band stacking shows the differences between the pre-burn and post-burn data. Figure 1,2,4,5,6,9 are in a 5,3,2 band stack, meaning the red represents near-infrared, the green represents the red band and the blue represents the green band. Figure 8 is in the NIVD index, this image helps show the vegetation index of the area, and you can see that the burned areas are mostly burnt with some vegetation remaining not burnt. Figure 7 is the same as figure 8, but the color scheme is set to the red band being one, and the green band being 4 and the blue band being 5. This turns the burnt plots red and changes the color of the vegetation to a teal blue, and the trees to a darker blue. The Paths are orange.
 |
| Figure 1. False Color IR imagery of the pre-burn data set of Martell Forrest |
 | |
|
 | |
|
 |
| Figure 4. False Color IR imagery zoomed in of the post-burn data set of Martell Forrest |
 |
| Figure 5. False Color IR imagery of the pre-burn data set |
 |
| Figure 6. False Color IR imagery of the post-burn data set |
 |
| Figure 7. Custom band stack of post-burn dataset |
 |
| Figure 8. NDVI Imagery of the post-burn dataset |
 |
| Figure 9. False Color IR of postburn to compare with NDVI |
Conclusion and Reflection
The use of multispectral imaging helps provide better data on which sections are burnt and which have not to be burn in a controlled burn. The uses are much more than, as the data can also be used to determine the health of the surrounding fields, as well as if ash had drifted into a nearby section and caused that to start on fire. In conclusion, the use of multispectral data with uas can help collect data on different aspects of the area that is being monitored.This lab added no benefit to my educational experience as I had already done this lab and worked with this data prior. https://nicholas309.blogspot.com/2019/11/multi-spectral-image-indices.html


Comments
Post a Comment