Introduction
ERSI Landsat is a tool in which one can look at various parts of the world using satellite imagery. Although the data in landsat does not have as high of a pictorial resolution, it is much easier to view the imager in a broader context. We looked at multiple different settings and portions of the light spectrum to gain insight into different parts of the world.
Methods
For the first image area surveyed, it was the farmland around Purdue, in the infrared color spectrum. This was used to capture images to understand where the healthy vegetation was located in the area. The light spectrum used the 700 nm - 1mm portion of the EMA band. The brighter the red in the images, the healthier the vegetation.
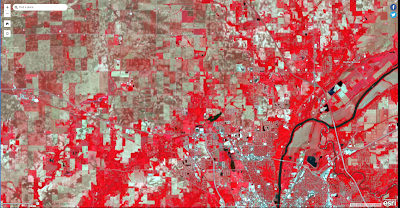 |
| Figure 1. Infrared Satellite imagery around Purdue University |
Next, we viewed satellite data as an index. This allowed different moisture indexes to be seen and look at areas that would be good for farming and have more moisture.
 |
Figure 2. Door County, WI, Viewed in the Agricultural index setting
|
 |
Figure 3. Lancaster, Californa, Viewed in the Agricultural index setting
|
Next was using historical data and comparing it with modern imagery, to understand urban development over a time period of an area. This imagery focused on Las Vegas and Pheonix as they have both expanded relatively recently.
 |
Figure 4. Las Vegas, Nevada Satellite imagery recorded on May 12, 1975
|
 |
Figure 5. Las Vegas, Nevada Satellite imagery recorded on September 7th, 2020
|
 |
Figure 6. Pheonix Arizona Satellite imagery recorded in 1975
|
 |
| Figure 6. Pheonix Arizona Satellite imagery recorded on September 9th 2020 |
While having maps of whole city development is beneficial, UAS can supplement that information by providing higher resolution imagery of a smaller area. They can record data more often as well. Some projects are operating a uas mission over the same area 4+ times a day to track changes at a higher frequency.
Next was creating different band stacks, a basic guide to band stacks for spectral imagery can be seen in the table in figure 7. These were used to create custom filters to look for certain indices in the imagery.
 |
Figure 7. A basic guide to imagery bands and what they show.
|
 |
| Figure 8. Egg Harbor, WI, Bands (1,2,5) |
 |
| Figure 9. Egg Harbor WI, Bands (3,5,7) |
 |
| Figure 10. West Lafayette, IN, Bands (1,5,7) |
 |
Figure 11. Winnetka, IL, Bands (3,5,6)
|
 |
Figure 12. Winnetka, IL, Bands (3,5,6)
|
Conclusion and Reflection
This lab indirectly related to UAS and focused on imagery analysis, this did not improve my ability to collect and produce any relative data from UAS. While satellite imagery can be used to supplement UAS data, I was unsure of what to look for in the imagery, as there was not a clear goal of what to produce with the custom band stacking imagery.


Comments
Post a Comment