Posts

Showing posts from 2020

Introduction to PIX 4D, with GCPs

Image
 Introduction Pix4D is an application for processing drone imagery and creating various types of orthophotos. The orthophotos can be used to analyze the imagery in a 2d map or a 3d imagery. It can be used with all sorts of sensors and methods of capturing imagery, from a simple DJI Mavic pro to a Sony a6000 with a PPK GPS for positing. In this lab, a few sample datasets were processed to aid in the introduction of this application.  Methods In this lab, data captured on the Purdue Wild Life Area was processed. This data was taken with various aircraft and was all processed in PIX4D. This lab served as an introduction on how to process the different aircraft data as they each have a different set of parameters.  Mavic 2 Pro The Mavic 2 Pro was flown in a grid pattern, and it captured 81 images that were stitched into an orthophoto in Pix4D. The Mavic Pro 2 has a camera with a rolling shutter. Hence, it is important to verify that the automatic camera settings have applied...

ARC Collector

Image
 Introduction  ARC collector is a mobile phone application that connects with ARC online. This allows a user to walk around with their mobile device to record GPS points that are stored in a cloud based map. This could be used for different applications with UAS, such as annotating an orthophoto map with features, such as water fountains in a park or utility poles on a farm.  Methods For this lab, a guide on using Arc collector was followed. Here is the link to the guide  https://www.esri.com/arcgis-blog/products/collector/field-mobility/try-collector/   For the creation of my map, I went to Davis Farry Park in Lafayette. At this location, I tagged the GPS location of Power poles, trees, and signs at the park that could potentially impact any flight operations over and around the entrance drive. Figures 1-5 show the addition of a point designating a sign next to a tree near the entrance of the park.  Figure 1. Entering the Map from the ARC collector Appl...

Coordinate systems and Projections

Image
Introduction For this lab, an ERSI course on projections and coordinate systems was completed. This course taught the basics of geographic coordinate systems and projected coordinate systems.  Methods The ERSI course's primary focus was on GIS functions and how the coordinate systems allow them to function properly. There are two types of coordinate systems used for mapping: geographic coordinate systems and projected coordinate systems.  Geographic coordinate systems are based on the location being on a globe. This is better for larger-scale operations as there is no distortion and all the points are at their true location. The location is measured in Lattitude and Longitude, each being written down in Degrees minutes seconds.  Projected coordinate systems are based on the locations being on a flat surface. This can create issues because, on a global scale, there will be distortions. The locations on the map can be measured in meter/feet or any other linear scale....

Measure Ground Control

Image
Introduction Measure ground control (MGC) is an application in which there is everything from flight operations to mission creation and data management. A benefit of Measure over DJI GSP is that one person can create flights and assign them to different pilots.  Methods In learning this application's uses, we watched an instructional video on how Measure ground control is used link . The application is divided into a few subcategories.  Missions & Checklist In the missions section of MGC, the pilot can create missions and view their missions to complete and the missions that they have completed. The other portion of this subsection is the checklist. In the checklist, the user can set up a checklist to aid in the mission. A checklist is an important function of an operation because they ensure that the aircraft is set up the same way every time, no matter who uses the aircraft and sensors.  Figure 1. Mesure ground control checklist function Airspace map The airspace ...

Datums

Image
Introduction Geographic Datums are important for processing any GIS-related data. A datum, simply put, is the reference point. For an aircraft, it would define where you locate components on the aircraft from. It's the 0,0,0 reference point. Geographic datums and referencing systems are a bit more complex because there is more than one point for the areas that one may be studying. In the lab, we learned how to correct a datum and reference point settings in ARC GIS Pro.   Methods To begin, we were given an excel spreadsheet of points referenced in X, Y, and Z. These points did not have any specific units of measure with them or coordinating reference data, which is where the reference systems and datums came into play. When the data points were put into the spreadsheet, the latitude and longitude were flipped, so the default results located the points on the opposite side of the globe. The corrections were made by swapping the latitude and longitude to move the points to thei...

Field Outting

Image
Introduction This was the first attempt at a field outing to fly a Mavic 2 pro and M600 Pro to collect data at Purdue wildlife area. The weather and other factors made it challenging to collect the data required.  Operations Mission     I personally could not tell you what the goal of this mission was other than 2 flights, one with an M600 pro with a RGB and red edge sensor, and another flight with a mavic 2 pro.    Location & Weather conditions The location was Purdue wildlife area, it is a controlled prairie near some tall forest. This provided some interesting conditions and challenges for collecting the data with the present weather conditions.  The weather was clear sky and winds from 200 deg at 8 knots, gusting to 21 knots.  For the prairie the winds were blowing it during the entire flights, therefore I would expect to see lots of motion blur in the data. Also, the winds were above the M600 Pros operating conditions specified by the manufact...

DoakBurn (Again)

Image
 Introduction The goal of this lab was to use ArcGIS Pro to view the various band stacks of orthomosaic imagery and a normalized difference vegetation index (NIVD). The data was collected by Dr.Hupy, William Weldon and Zack Miller, and the data was of a controlled burn with multispectral cameras. Methods The methods of this lab was to look at the areas that were burned and compare them to the areas around them that were not burned. This could be done with RGB, or band stacking for the imagery, which allows the ability to see things that are not able to be seen with the human eye.  Metadata from the Flight Vehicle: Bramor PPX Sensor: Altum Flight Number: 2 Takeoff Time: 12:18 Pm Landing Time: 12:35 Pm Altitude (m): 121 Sensor Angle: NADIR Results  The data collected with the band stacking shows the differences between the pre-burn and post-burn data. Figure 1,2,4,5,6,9 are in a 5,3,2 band stack, meaning the red represents near-infrared, the green represents th...

ERSI Landsat Blog

Image
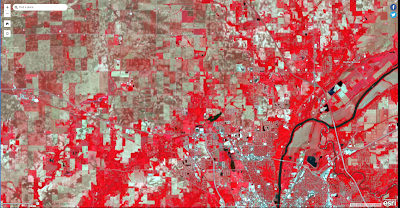
Introduction  ERSI Landsat is a tool in which one can look at various parts of the world using satellite imagery. Although the data in landsat does not have as high of a pictorial resolution, it is much easier to view the imager in a broader context. We looked at multiple different settings and portions of the light spectrum to gain insight into different parts of the world.  Methods For the first image area surveyed, it was the farmland around Purdue, in the infrared color spectrum. This was used to capture images to understand where the healthy vegetation was located in the area. The light spectrum used the 700 nm - 1mm portion of the EMA band. The brighter the red in the images, the healthier the vegetation.  Figure 1. Infrared Satellite imagery around Purdue University Next, we viewed satellite data as an index. This allowed different moisture indexes to be seen and look at areas that would be good for farming and have more moisture.  Figure 2. Door County, WI, V...