Posts

Showing posts from 2019

LOC8

Image
Introduction LOC8 is a software that processes images and identifies pixels that are in a color range. This is primary being used in search and rescue, but has its applications in other uses. In this lab LOC8 was used to view images that were taken over an area, and the goal was to find a pair of jeans, and a skeleton in a flannel shirt. Methods The first thing was to set up the settings of the LOC8 software, these software settings allow the ability to fine tune the software to get it to identify what you want to find. Figure 1. LOC8 Settings Then once the base settings were setup I set up a color range for the LOC8 software to find. Figure 2 shows the color range that was used. This color range was used as it covered a range that the jeans were expected to show up as. Figure 2. LOC8 jeans color range  Then the images were processed and a few images were found. The jeans were in one of the targets after some time changing the settings to search different parts of th...

Mission Planning Search and Rescue

Image
Introduction The goal of this lab is developing a plan for an operation where a person went missing in Martell Forest and search teams are sent out within an hour. There is an idea where the person is but they could have moved, it is expected that they will be found. The gear that is to be used Bramore PPX, with Altum multispec, or a sony RX1 M600, with Sony A600, Mica Sense Red edge, FLIR XT2 Figure 1. A map of Martel forest Figure 2. The airspace map of the area Methods Initial action The plan for the initial action is to do a hasty search with the Matrice 600, with the FLIR XT2 camera. This is the plan for the hasty search, as the thermal imaging should be able to identify the person quickly as there is a large temperature difference between the person and the forest in November. The use of the M600 would be a hasty search and searching in an outward spiral from where the person is expected to be. This is because there is a rough idea of where the individual could...

Metar TAF and Airmets

Image
Introduction  The use of metars, tafs and airmets are the accepted ways to gather weather information for a commercial operation of a uas. The weather requirements for uas operations under part 107 include, a minimum of 3 statue miles of viability and must be 500 feet below and 2000 feet to the side of the clouds.  Decoding a Metar and Taf Figure 1. Metar and Taf for klaf on 11/8/19 at 2149 UTC Lets start with decoding this metar,  KLAF         The airport, Lafayette airport  072054Z     Date and time 7th of the month, 2054 UTC 33013KT     Wind at 330 degrees true, 13 Knots 10SM          10 statute miles of visibility   CLR 02/M09   Clear 20000 less than 90000 A 3037      Altimeter   30.37 inches HG RMK         Remarks AO2          Automated collection with precipitation sensor ...

Airspace for UAS operations

Image
Introduction Airspace is one of the most important things when operating a UAS, it becomes even more important when operating under part 107 as you can transition into airspace while flying within 400 feet of a structure, Methods Operations that take place in air space are broken down into a few key parts, the class of airspace being the most important one. The sectional chart legend Figure 1. the sectional charts show the symbols for the airspace, airports, and obstructions. These symbols allow the pilot to understand the sectional charts. Another Chart the FAA put out recently is the Airspace Guidance for Small UAS (Figure 2) which helps operators know how the airspace looks and what authorization is needed. Both of these were used for the sectional chart and airspace analysis of the operation locations, but more information was needed for the areas so other things were used to supplement the briefings. Figure 1. Sectional Chart Legend from the FAA Figure 2, FAA airspace g...

Multi-spectral image indices

Image
Introduction The goal of this lab was to use ArcGIS Pro to view the various band stacks of orthomosaic imagery and a normalized difference vegetation index (NIVD). The data was collected by Dr.Hupy, William Weldon and Zack Miller, and the data was of a controlled burn with multi spectral cameras. Methods The methods of this lab was to look at the areas that were burned and compare them to the areas around them that were not burned. This could be done with RGB, or band stacking for the imagery, which allows the ability to see things that are not able to be seen with the human eye. Results  The data collected with the band stacking shows the differences between the pre burn and post burn data. Figure 1 and Figure 2 show the data in standard RGB, these images are good as a base, and give us a better idea of that we are looking at. In figure 2 take note of the not burned section in the middle burned section as that can be seen more clearly in the other figures. Figure 3. and F...

Intro to ARC pro GIS

Image
Introduction The goal of this lab was to get more familiar with ARC pro GIS. I chose to fallow a tutorial on planning a timber harvest, which involved doing data analysis to Identify approximately how many trees would be harvest this season. I chose this topic as I thought it would be an interesting application for remote sensing, and would allow companies to more easily estimate harvest, therefor estimating revenue and income. Methods The method was to fallow the ARC pro GIS tutorial and the end result for the estimated harvest was to get the number of acres of aspen trees that were going to be publicly harvested and the numbers of acres that were going to be industrially harvested. The public state-owned land had harvesting limitations on the trees being older than 50 years, on more than 20 acres of land, and in a specific soil category. The Industrial owned land harvest had the trees had to be older than 40 years and that was it.  Each group has their own restrictions, so th...

More Thermal Imaging

Image
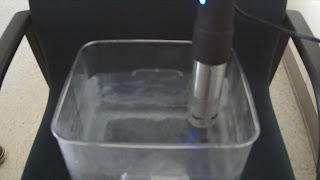
Introduction The goal of this lab was to better understand the thermal heat transfer between objects and their surroundings. The better understanding of thermodynamics helps with the analysis for future infra-red (IR) data collection. Methods Figure 1. A RGB Image of the sousvide setup In this lab, the method to image the temperature change of objects to collect data on their rate of heat transfer was by placing 4 3d printed planes into a hot water bath, and imaging it with an IR camera. Three of the four planes were frozen and one was put into a plastic bag with no air, one was put into a plastic bag with air, and one was put into a wool sock. Their was also a plane which was keep at room temperature and placed into a plastic bag with air. All planes were placed into the hot water bath and the IR sensor, specifically a Zenmuse XT2 camera, watched the airplanes to see how their temperature changed over time. Figure 2. An IR image of the sousvide Results  Each ...

Intro to Thermal Imaging

Image
Introduction The goal of this lab was to get a better understanding of thermal cameras, how they work, and what they can and cannot do. The thermal camera used to capture the images was a FLIR E series.  Methods The methods for testing the thermal camera involved using it capture images, to gather data on their thermal values. Some of the things that had to be considered while capturing the images were the use of false color, and the use of overlaying thermal over electro optical (EO) images .   Their were 2 color palates that were used in the lab, Ironbow, which is yellow hot and purple for cold, and a black and white scale. The benefits of the Ironbow palate was that it was easier to identify which part is cold and which is hot as this is how one would normally expect as people have associated blue with cold and red for hot. A drawback of using the iron coloration is that some detail is lost in the process of adding the color. The benefits of using the black a...
Image
LineVision- Ultimate Introduction The goal of this lab was to use the software LineVision to analyze a video and gather different GPS points from the video. Methods The first task was to find the GPS coordinates of the Green trees in the burn area, the location that was identified for the 3 trees, A, B and C, tree A is in the top left , below it is tree B and below tree B is tree C, the smallest. The gps points of  latitude of 40.449934, and a longitude of -87.050567 for tree A, latitude of 40.449613 and a longitude of -87.050603 for tree B, and a lattitude of 40.449298, and a longitude of -87.049173 for Tree C. Tree A and B are relatively accurate for their GPS locations, but tree C is not as their was an issue with the software that inverted the side of the camera that the location of the point was if it was below the mid-line of the horizontal. Figure 1, This image is a screen capture of the LineVision software, the 3 blue dots represent the tree locations in relat...