Introduction
The goal of this lab was to use ArcGIS Pro to view the various band stacks of orthomosaic imagery and a normalized difference vegetation index (NIVD). The data was collected by Dr.Hupy, William Weldon and Zack Miller, and the data was of a controlled burn with multi spectral cameras.
Methods
The methods of this lab was to look at the areas that were burned and compare them to the areas around them that were not burned. This could be done with RGB, or band stacking for the imagery, which allows the ability to see things that are not able to be seen with the human eye.
Results
The data collected with the band stacking shows the differences between the pre burn and post burn data. Figure 1 and Figure 2 show the data in standard RGB, these images are good as a base, and give us a better idea of that we are looking at. In figure 2 take note of the not burned section in the middle burned section as that can be seen more clearly in the other figures. Figure 3. and Figure 4. use Band stacking in 4,3,2 meaning the Red in the photo represents the red edge band, the green in the photo represents the red band and the blue represents the the green band. In figure 4. you can see the pink color in the middle burn field, this better represents the section that was not burned during the controlled burn. Figure 5 and Figure 6 are in the 5,3,2 settings, meaning the red represents near infrared, the green represents the red band and the blue represents the green band. You can see in figure 5 and 6 that the pinks and reds are brighter than figure 3 and figure 4, as the near infrared shows up better than the red edge band. Figure 7 and Figure 8 are in the NIVD index, these images help show the vegetation index of the area, and you can see that the burned areas are mostly burnt with some vegetation remaining not burnt. Figure 9 is the same as figure 8, but the color scheme is set to the "precipitation" color scheme, which shows the sections without vegetation in orange in the sections with some vegetation in light green and the dense vegetation in dark blue.
 |
| Figure 1. Preburn image in RGB |
 |
| Figure 2. Post Burn RGB |
 |
| Figure 3. Preburn image in 4,3,2 |
 |
| Figure 4. Post burn 4,3,2 |
 |
| Figure 5. Preburn image in 5,3,2 |
 |
| Figure 6. Post burn, 5,3,2 |
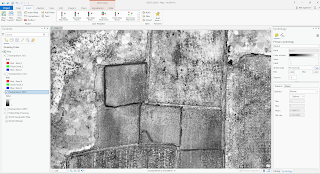 |
| Figure 7. Preburn NIVD |
 |
| Figure 8. Post Burn NIVD |
 |
| Figure 9. Post burn NIVD precipitation color index |
Discussion
The use of the multi spectral imaging helps provide better data on which sections are burnt and which have not be burn in a controlled burn. The uses are much more than, as the data can also be used to determine the health of the surrounding fields, as well as if an ash had drifted into a nearby section and caused that to start on fire.
Conclusion
In conclusion the use of multi spectral data with uas can help collect data on different aspects of the area that is being monitored.


Comments
Post a Comment