Intro to ARC pro GIS
Introduction
The goal of this lab was to get more familiar with ARC pro GIS. I chose to fallow a tutorial on planning a timber harvest, which involved doing data analysis to Identify approximately how many trees would be harvest this season. I chose this topic as I thought it would be an interesting application for remote sensing, and would allow companies to more easily estimate harvest, therefor estimating revenue and income.
Methods
The method was to fallow the ARC pro GIS tutorial and the end result for the estimated harvest was to get the number of acres of aspen trees that were going to be publicly harvested and the numbers of acres that were going to be industrially harvested. The public state-owned land had harvesting limitations on the trees being older than 50 years, on more than 20 acres of land, and in a specific soil category. The Industrial owned land harvest had the trees had to be older than 40 years and that was it. Each group has their own restrictions, so the data had to be analyzed to find what fit each category.
Results
First off, the data did not have acreages as a unit of measurement, so that had to be added. This allowed the measurements to be in acres which was needed as the limits on the areas that could be harvested were also in acres. In Figure 1 the bar chart shows that there were 65,258.88 Acres that contained aspen trees.
The next step was to identify what the number of acres of aspen were not in industrial locations. This was done with a new query, and the number of acres with aspen decreased down to 55,333 which is what one would expect when removing areas from the data set.
Their is another restriction which had to be applied to the data set, a restriction around waterways. This is because the data currently includes the acres that are over water, but their is a restriction in which no logging can take place within 100 feet of water ways.
Next was identifying the harvest that were going to take place on industrial owned lands. The two constraints were that the lands need to be industrial owned and the trees needed to be over 40 years old, figure 5 depicts the constraints added, and figure 6 depicts the estimated harvest.
The next task was to collect an estimate on how much land was going to be harvested by the public state-owned land. Figure 7 depicts the criteria for the trees that are harvested from the state-owned land aspen. Figure 8 depicts the spots to be harvested in the light green.
The final task was to convert the acreage estimate to cord estimates, as that better describes the amount of wood to be harvested. The calculations for the cords were 131,535 total cords of wood, and cut 5937 acres of aspen trees.
Discussion
There were some challenges during this tutorial, those being and issue with the code given to estimate the amount of cords of wood from the acres that were going to be harvested. I got a different number than the one that the tutorial originally had. With a little manipulation those errors were corrected. This tutorial was very interesting as the GIS information was able to help identify which areas were going to be harvested this season and approximately how many trees were going to be harvested. I learned more about how GIS is able to predict data and allow companies to increase their margin by using the data to better plan their cost and expenses for the next season. There are other tutorial that include more with remote sensing and I believe those would be very interesting to see the applications of them.
Conclusion
In conclusion, ARC GIS Pro can play a key roll in analyzing uas data, and help make predictions to make business more efficient and decrease cost of production. ARC GIS pro can also be used to make connections to where a company is likely to see losses or profits and what actions they should take to keep making a profit.
The goal of this lab was to get more familiar with ARC pro GIS. I chose to fallow a tutorial on planning a timber harvest, which involved doing data analysis to Identify approximately how many trees would be harvest this season. I chose this topic as I thought it would be an interesting application for remote sensing, and would allow companies to more easily estimate harvest, therefor estimating revenue and income.
Methods
The method was to fallow the ARC pro GIS tutorial and the end result for the estimated harvest was to get the number of acres of aspen trees that were going to be publicly harvested and the numbers of acres that were going to be industrially harvested. The public state-owned land had harvesting limitations on the trees being older than 50 years, on more than 20 acres of land, and in a specific soil category. The Industrial owned land harvest had the trees had to be older than 40 years and that was it. Each group has their own restrictions, so the data had to be analyzed to find what fit each category.
Results
First off, the data did not have acreages as a unit of measurement, so that had to be added. This allowed the measurements to be in acres which was needed as the limits on the areas that could be harvested were also in acres. In Figure 1 the bar chart shows that there were 65,258.88 Acres that contained aspen trees.
 |
| Figure 1. An image showing the acreages of the trees by veg type |
 |
| Figure 2. An image depicting the acres by veg type, not including land owned by industrial uses. |
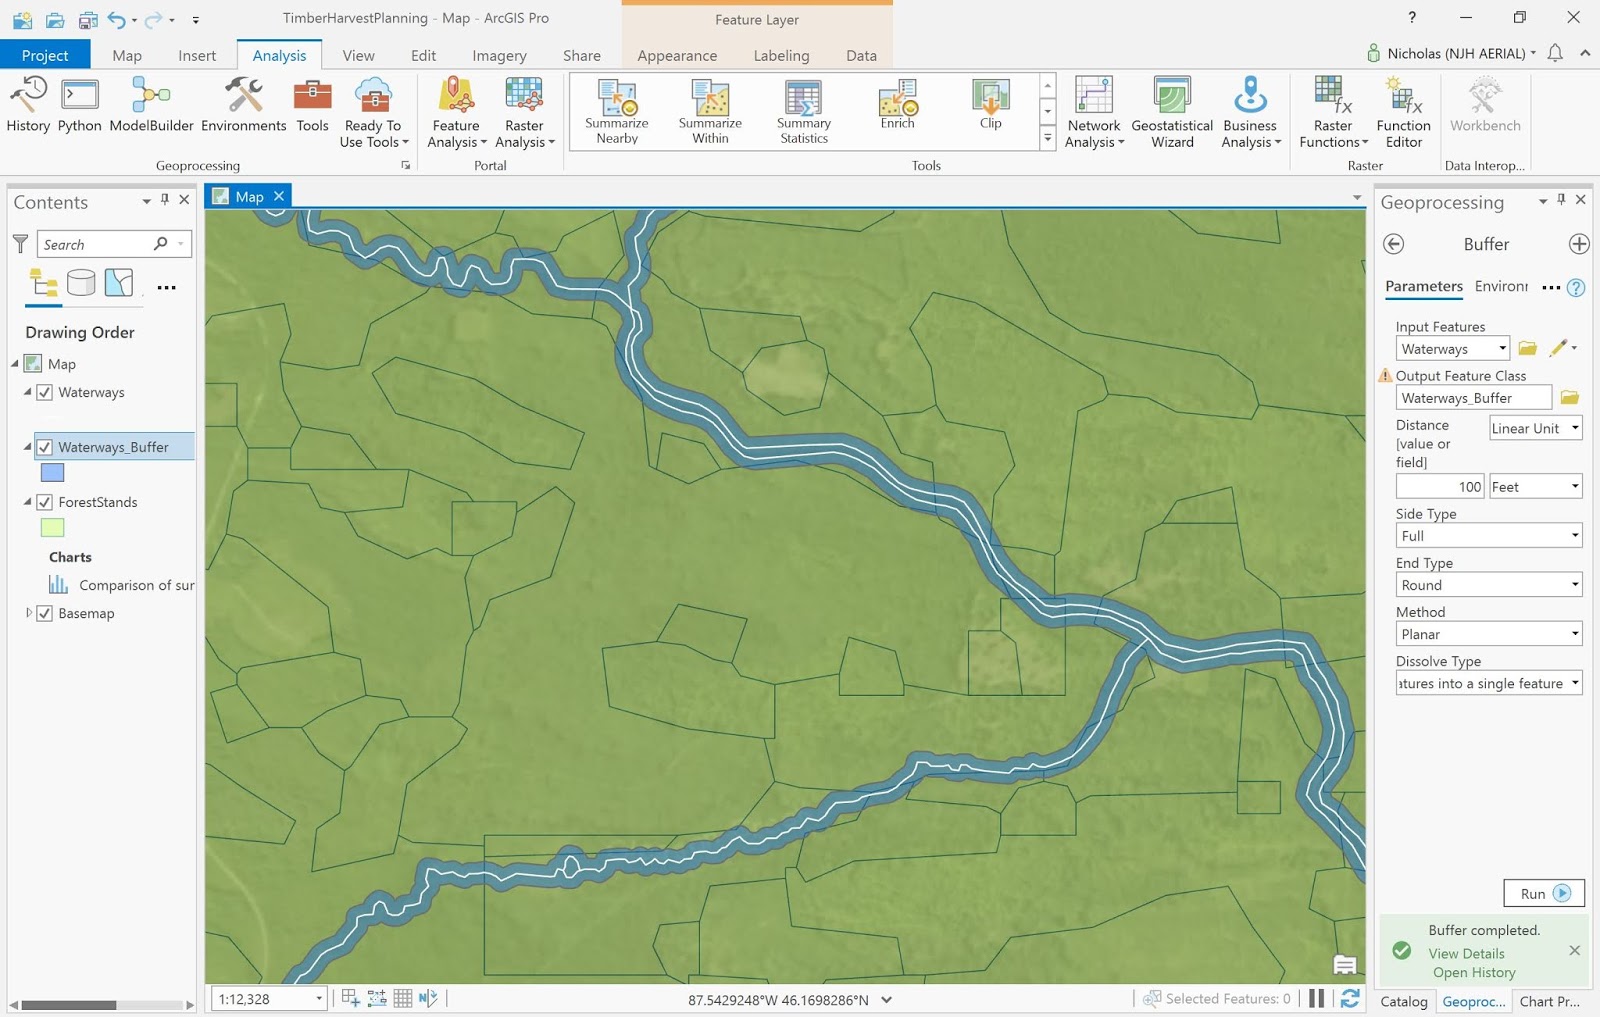 |
| Figure 3. An image depicting the waterways and the restricting areas, which are highlighted in blue. |
 |
| Figure 4. An image depicting the new acreages after the area around the water ways has been removed. |
 |
| Figure 5. A image of the queries that were used to constrain the data to collect the information for the industrial harvest |
 |
| Figure 6. An image of a new map which depicts the areas, In light green, that are expected to be industrially harvest |
 |
| Figure 7. An image depicting the queries that restrict the public state-owned land aspen harvest. |
 |
| Figure 8. A Map depicting the area of land, in light green, that is going to be harvested under the public state-owned harvest |
Discussion
There were some challenges during this tutorial, those being and issue with the code given to estimate the amount of cords of wood from the acres that were going to be harvested. I got a different number than the one that the tutorial originally had. With a little manipulation those errors were corrected. This tutorial was very interesting as the GIS information was able to help identify which areas were going to be harvested this season and approximately how many trees were going to be harvested. I learned more about how GIS is able to predict data and allow companies to increase their margin by using the data to better plan their cost and expenses for the next season. There are other tutorial that include more with remote sensing and I believe those would be very interesting to see the applications of them.
Conclusion
In conclusion, ARC GIS Pro can play a key roll in analyzing uas data, and help make predictions to make business more efficient and decrease cost of production. ARC GIS pro can also be used to make connections to where a company is likely to see losses or profits and what actions they should take to keep making a profit.


Comments
Post a Comment