Volumetrics
Introduction
This blog is about using ARC pro to gather volumetric data from imagery captured with drone flights. Using drones to collect data in this way is much quicker and safer than other methods.
Methods
ARC Pro tools
There are 4 main tools we use in ARC Pro for volumetric analysis, extract by mas, resample, surface volume, and cut fill. The task that each one does is described in detail below
Extract by mask allows for a specific area of a dataset to be clipped out for either visualization or processing.
Resample changes the spatial resolution of the dataset and downsamples the resolution so it can process faster and keep a reasonable amount of precision.
Surface volume is a tool that is used to calculate the volume displaced above a certain elevation and that volume and surface area is calculated.
Cut-Fill compares 2 datasets and shows the differences in the height and volume of them with showing the areas net gain, net loss, and unchanged elevations. This is a qualitative/visual reference tool, whereas the others are quantitative measurements.
How to Calculate a Volume
Workflow for calculating a volume:
1. Start with creating a new feature class
2. Name the feature class ProjectPileA_Clip
3. Then go to the edit tool and click create
4. Draw out the polygon around the area of interest
5. Then open tools and run the Extract by mask tool
6. Extract the mask portion of the original DSM
7. Name that file ProjectPileA_Clipped
8. take that DSM and find the average minimum height around the pile by left-clicking the area.
9. Finally run a surface volume tool and calculate the volume using the height you found in step 8 as the surface elevation.
Wolf Creek
To begin with Wolfcreeks processing, we first have to understand the metadata for the datasets. The metadata shows a GSD resolution of 0.02 M x 0.02 M.
 |
| Figure 1. The imagery of Wolf Creeks mine, with volumetric calculations of a few of the material piles. |
Dredge site
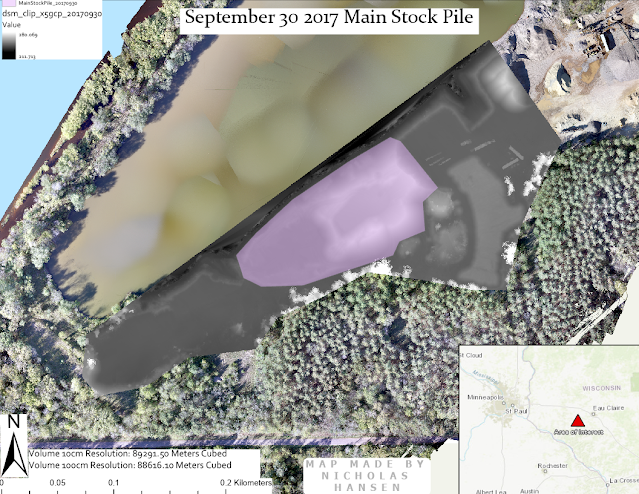
Data was collected on the main stockpile on a dredge site, it was collected 3 separate times. This data can be used to estimate the amount of volume removed and transferred to get the net change of the pile.
 |
| Figure 2. Imagery of the dredge stockpile in July |
 |
| Figure 3. Imagery of the dredge stockpile in August |
 |
| Figure 4. Imagery of the dredge stockpile in September |
Then we performed a Cut-Fill between the July 22nd and Sept 30th Data Set.
 |
| Figure 5. Imagery of the dredge stockpile with a cut-fill comparison between July and Septembers piles |
There is a net gain in the regions around the center and west and northeast of the pile. There is a net loss around the east face of the pile and to the west of the pile.
So the client would ask "Are there errors in this data?" Yes, the areas south of the pile had both net loss and net gain. The trees provided some issues in the DSM. The way that the trees were in the imagery provided some issues for the DSM’s accuracy of the southern portion of the pile as they had been deemed as a higher elevation than the surface level. Cut-Fill is qualitative data as the map is a visual-based representation of net loss vs net gain. This can supplement your volumetric report by providing visuals for the customers to easier understand the data. Some inaccuracies in this data can be linked to the trees and the changing shadows/coloration of the DSM could contribute to variability. These errors have a minimal impact on the overall volume of the pile so it should be accurate enough.
Conclusion
Volumetric analysis is the calculation of spatial tied volumes of areas of elevation and depression. Volumetric analysis can have issues when the map includes things such as trees, shadows as well as water, and other changing/moving things. These can move and adjust the way that the DSM looks, therefore changing the volume of the shape. Other things such as booms from equipment the over piles can introduce other errors as well.
Calculating the estimated time to complete the task very important because it is a matter of being cost-effective, if someone surveying can get it done quicker, therefore cheaper, it is not worth it to continue. Hardware can reduce the time that it takes to render the data and process it. Cloud-based options could be good for processing with a minimal investment of hardware, and they could allow for processing while in the field, and making sure the data is set is good before leaving the job site. Resampling allows for the data set to be smoothed and reduces the amount of time it takes to process. The balance is between having too coarse and high of a resolution Other operations that use volumetric calculations could be things such as digging foundations of construction sites to identify the volume of dirt removed or the volume Volumetric Analysis with UAS Data of concrete needed. Another thing that volumetric calculations could be used for is calculation the volume of a drained pond, or retention area to ensure that they are able to handle the water runoff from nearby areas and structures.


Comments
Post a Comment